
Infographic Design and Familiarity with Different Types of Infographics

Posted by Mahdi Sadough
- Article Number: 15
It does not matter in what field you work or what brand you have, whether it is a company that seeks to raise capital or connect with the investors it needs, or a coach or teacher who wants to best present a subject to his or her students. In all these cases, you need a way to present a large amount of information to your audience in a simple, attractive and informative way.
An infographic can be the method you need. Follow this article to get acquainted with the types of infographics and infographic applications.
An infographic can be the method you need. Follow this article to get acquainted with the types of infographics and infographic applications.
Infographic applications
Infographic applications are not limited to one specific case and can cover a wide range of fields, from technology to medicine and education. Infographics present information in an attractive and simple graphic way in order to attract the attention and awareness of the audience. The best infographic designers use the basic design principles to display the information presented and make it easier to reach for a larger audience or to target a specific audience.
But which type of infographic is best? In one sentence, there is no such thing as the best infographic, and it all has to do with the purpose and design of the infographic.
"Creative moments that last a fraction of a second are all the time you have for street photography," says Henri Cartier-Bresson. You need to see the composition or the feeling that life itself gives you and understand it before you press the shutter button on the camera. This is the moment that the photographer creates and if you miss the moment, it is lost forever!
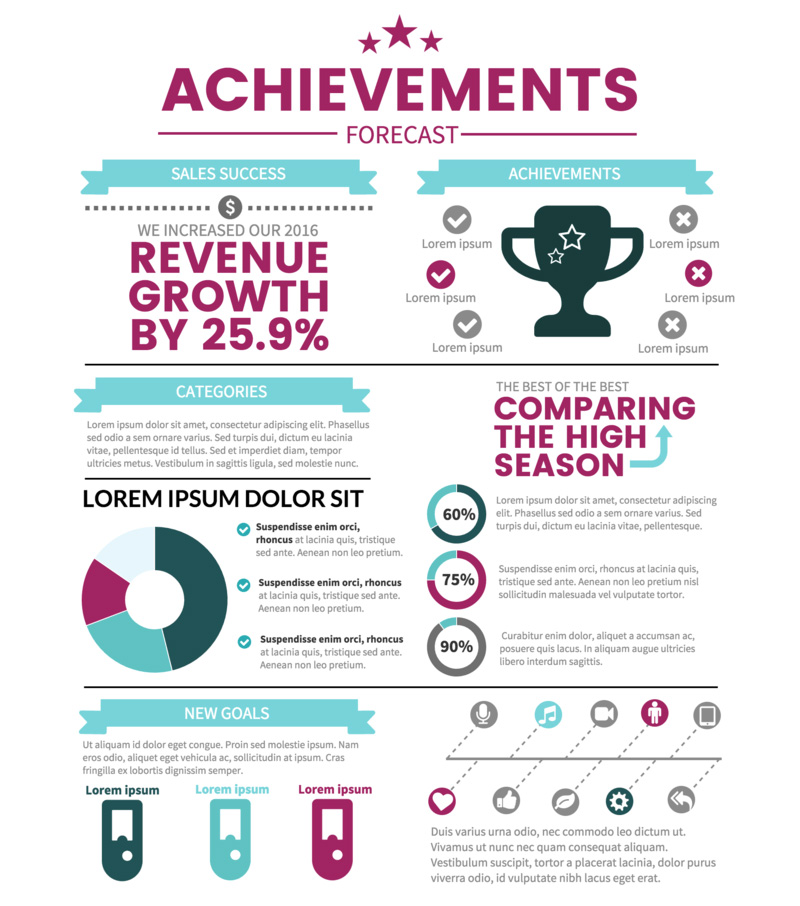
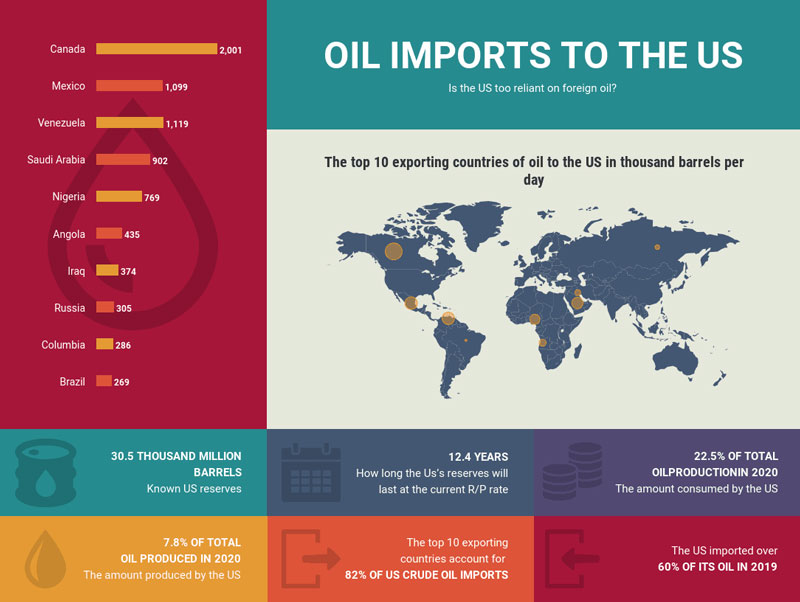
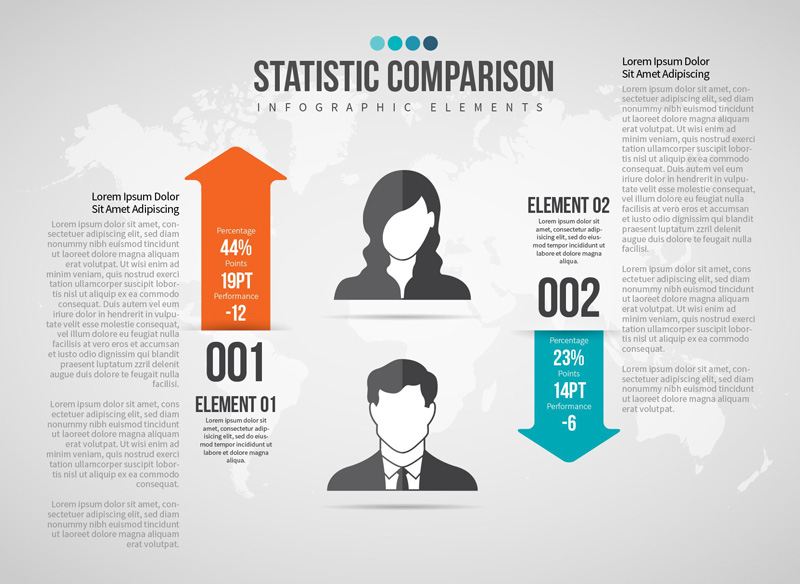
Statistical infographics are one of the most common types of infographics
If you want to show the results of a survey and analyze it for your audience, or provide data on a specific issue, a statistical infographic is the best choice to achieve this goal.
These infographics focus on data and help you present this information and analysis to your audience through designs and images. You can use attractive charts, icons, images and fonts to better convey information to users and audiences.
The best ways to create a statistical infographic:
These infographics focus on data and help you present this information and analysis to your audience through designs and images. You can use attractive charts, icons, images and fonts to better convey information to users and audiences.
The best ways to create a statistical infographic:
- Look for the story behind your data and reflect it in your design.
- Use different parameters and tools to present your data, such as charts, symbols, and text.
- Choose a title that fits the data in the infographic to reflect your goals.
- Emphasize the original data by using a contrasting color or associating the number with a symbol.
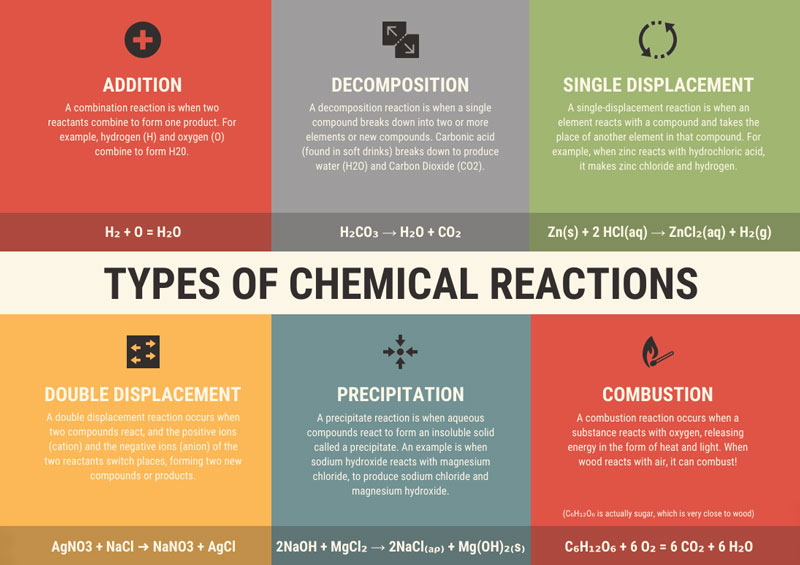
Information infographics
Information infographics are the best type of infographic to communicate a new or specialized concept or provide an overview of a topic. Typically, information infographics are divided into sections with descriptive titles to familiarize users with a new or specialized topic or topic. Numbering each section helps streamline your infographic design. In addition, according to existing research, audiences prefer infographics with numbered titles.
The best ways to create an information infographic:
The best ways to create an information infographic:
- Assign a descriptive title to each section so that the information provided to the user is clear.
- To help the information flow smoothly, number each section.
- Use different colors and images and visual effects to create more interaction with the audience.

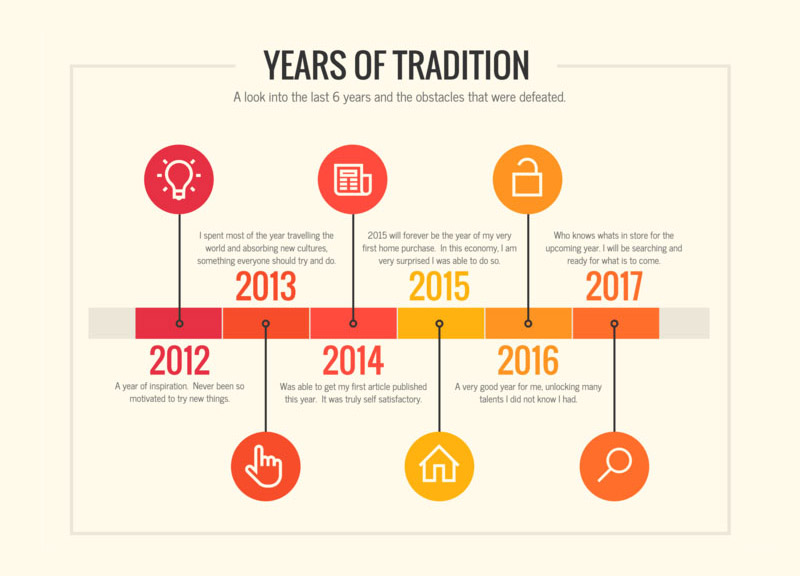
Timeline infographics, one of the best types of infographics for historical events
These types of infographics are the best tool for visualizing the history of a topic or a title and can be used for purposes such as highlighting important dates or providing an overview of historical events or a project schedule.
Because one tends to perceive time in a certain context, a visual image such as a timeline infographic can help to create a clearer picture of a time period.
The best ways to create a timeline infographic:
Because one tends to perceive time in a certain context, a visual image such as a timeline infographic can help to create a clearer picture of a time period.
The best ways to create a timeline infographic:
- Use a main line to establish between different time points.
- Use a highlighter or contrasting color to highlight the year or important events.
- Show any point in time with a simple symbol.
- If necessary, provide a brief description for each time period.
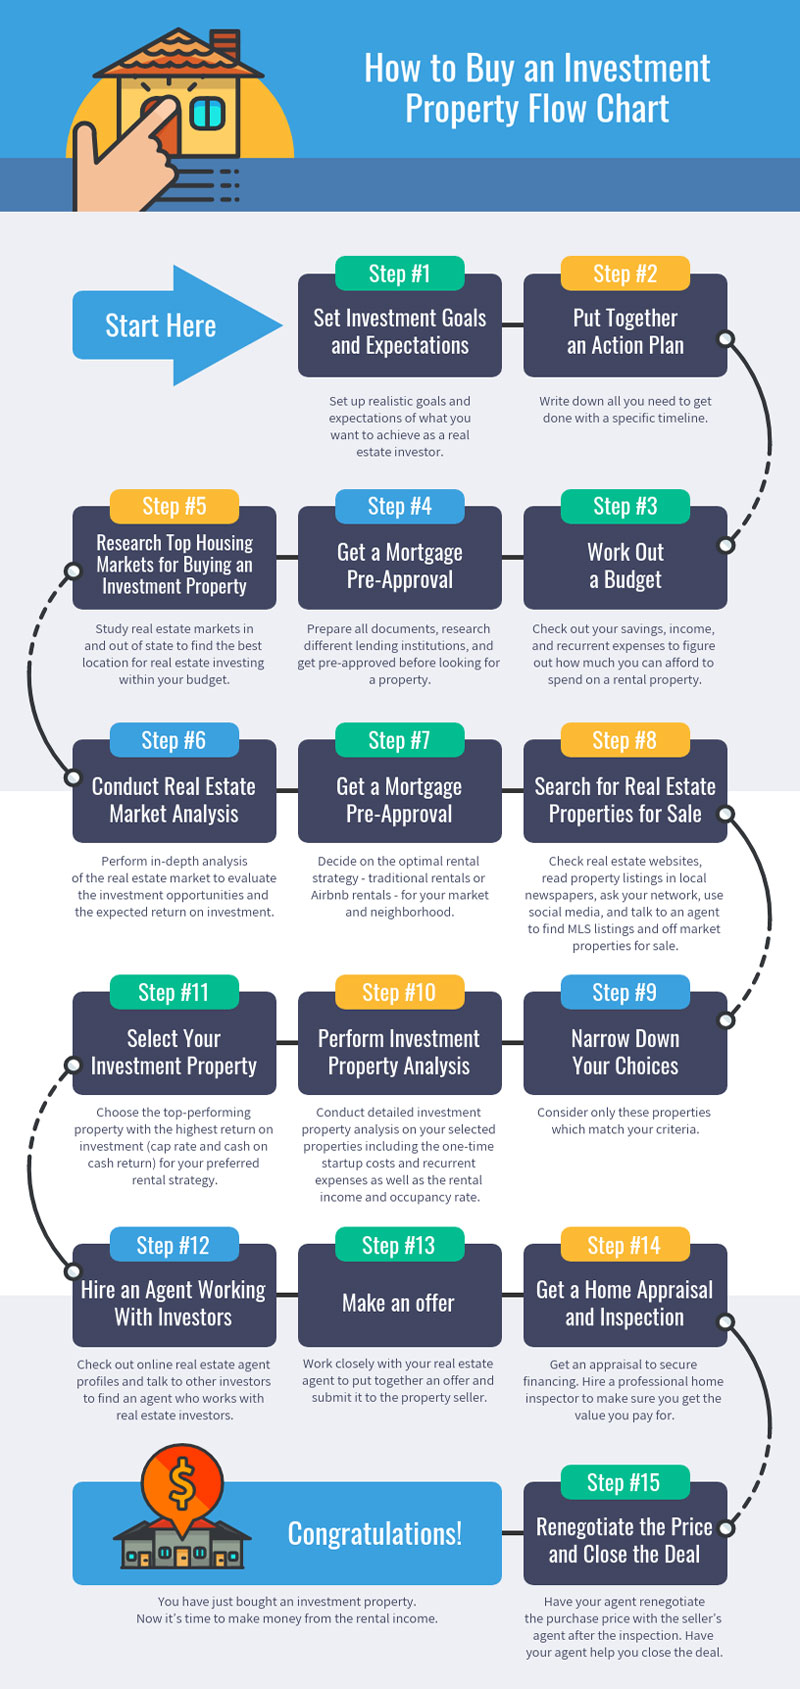
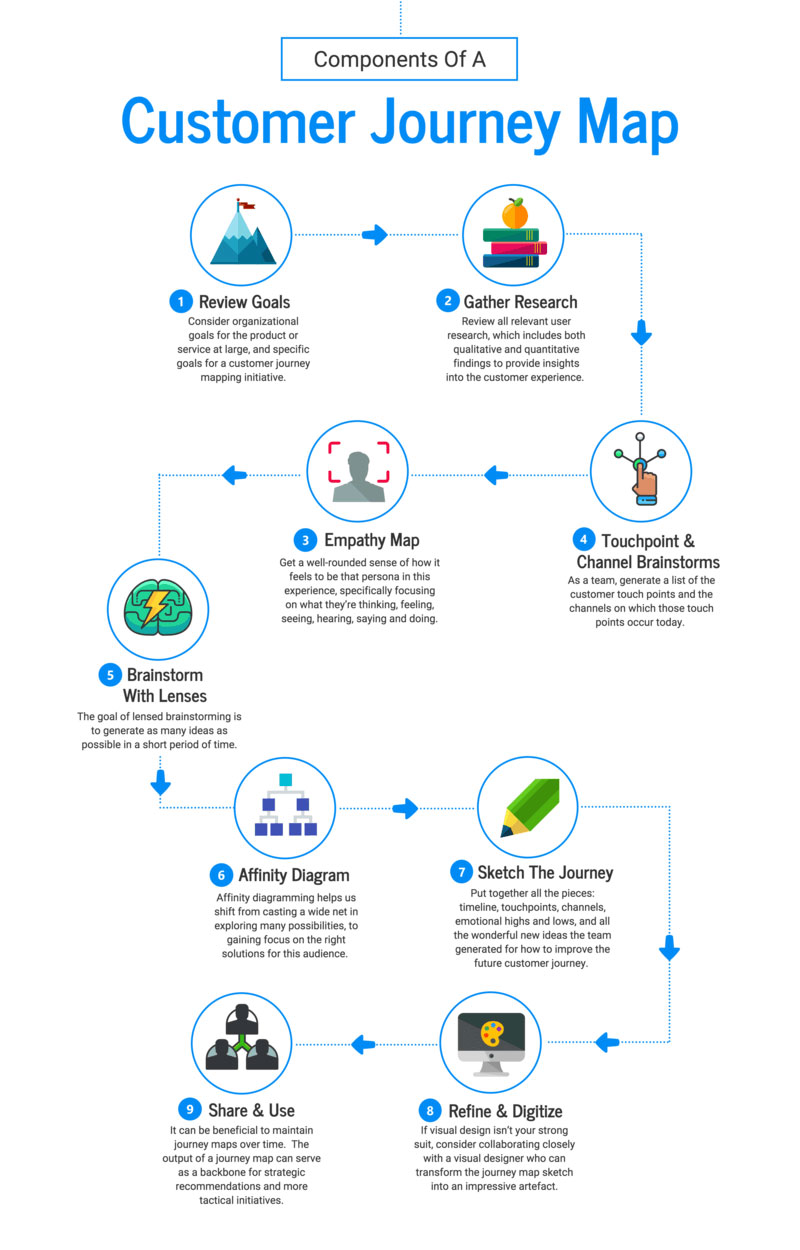
Process infographics
While timeline infographics highlight time points and draw the audience's attention to the timing of an event, process infographics are the best type of infographic to provide a summary or overview of a process.
The process infographic lets you describe each step in a simple and clear way for your audience. Most process infographics move from top to bottom or left to right to show users how a process evolves. Step numbering can easily describe your process.
The best ways to create a timeline infographic:
The process infographic lets you describe each step in a simple and clear way for your audience. Most process infographics move from top to bottom or left to right to show users how a process evolves. Step numbering can easily describe your process.
The best ways to create a timeline infographic:
- Number each step of your work to make it easier to understand.
- Use an S-shaped design to place different steps on a page.
- Use visual cues such as arrows to indicate the next point the user should pay attention to.
- Write your headers in different fonts or colors of the text to help highlight them.
Geographic infographics
Do you want to reflect data on topics such as demographic, spatial, or geographic data? In this case, geographic infographics will be the best choice for you.
Geographic infographics use map diagrams as a focal point and focus of your infographic. Diverse charts work best for different types of data, so be careful when choosing the type of map and the scale of the charts. For example, if you want to deal with an issue such as global warming, you should use a map that shows which countries have the greatest impact on global warming.
Geographic infographic templates can also be used to compare data by region or population. You can do this by putting several maps together.
Tips for creating the best geographic infographic:
Use a thermal map to show the ratio of population to geographic location and create a data hierarchy.
Use a series of maps to compare location-based information or show changes over time.
Clearly label the points on the map to make it easier to understand your information at a glance.
Comparative infographics
Most people have trouble comparing two products, this type of infographic is used to compare two products or offers. To compare two options based on existing metrics or a way to better represent a product, comparative infographics will be the best option among the available options.
In comparative infographics, the page is typically halved vertically or horizontally, with a product or option on each side. For example, in comparing two mobile phones, each is located on one side of the screen and their specifications are directly compared to each other.
In comparative infographics, the page is typically halved vertically or horizontally, with a product or option on each side. For example, in comparing two mobile phones, each is located on one side of the screen and their specifications are directly compared to each other.
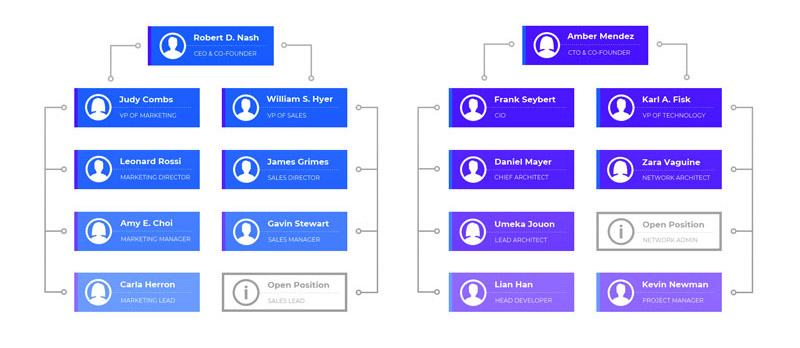
Hierarchical infographics
Hierarchical infographics can rank information from most to least, you can use a pyramid visualization that has the highest value of the pyramid base and the lowest value of a parameter or attribute. Food pyramid for children is one of the most famous of these pyramids in which foods that can be used for children are hierarchically graded and listed.
List infographic
If you are planning to share a collection of tips, a list of sources, or a list of examples, a list infographic will do the trick. Basically, this type of infographic is simple and the main purpose is to provide a series of examples or introduce a collection. According to this, try to create an attractive infographic so that the user interacts with your list, to achieve this you can Use attractive fonts, different colors for each example, and place images instead of the number of each example.
Resume infographic
With the current state of the job market saturated, job seekers need to find creative ways to stand out from the crowd and look unique. That's why infographic resumes have become so popular in recent years.
However, in most cases, an infographic resume can not completely replace the traditional resume. But they are a great visual document to present during a job interview, publish on the portfolio site or put in an email program and can be a great complement to the original resume.
However, in most cases, an infographic resume can not completely replace the traditional resume. But they are a great visual document to present during a job interview, publish on the portfolio site or put in an email program and can be a great complement to the original resume.
Which type of infographic will be the best choice for you?
Infographic applications are not limited to a specific topic or issue, and if you choose the right template for your purpose, you can provide the most information to your audience in the shortest time. Note that the main purpose of an infographic is to interact with different people, so try to create a principled, attractive and creative infographic.